 呆呆怪
呆呆怪思路
使用Vue-CLI脚手架搭建vue3.0,项目需要用到ECharts、Axios,需要设置反跨域文件vue.config.js,在src文件夹下创建api文件夹,创建http.js,随后在api文件夹创建一个新的文件夹mudelu,在该文件夹下创建first.js,最后还需要在assets文件夹下引入ECharts。
根目录 => src => api => `http.js`
根目录 => src => api => mudelu => `first.js`
根目录 => src => assets => `echarts.min.js`
根目录 => `vue.config.js`
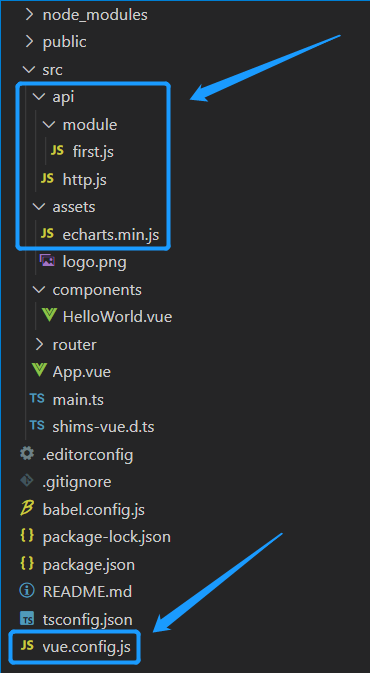 图示
图示
API
HTTP请求方式:POST
请求地址:119.3.172.37:8999/api/data
请求参数格式:JSON
请求示例:{"start" : "202101","end" : "202105"}
src => api => http.js
import axios from "axios";
axios.defaults.headers['Content-Type'] = 'application/json;charset=utf-8'
console.log(axios)

export function post(url,params) {
    return new Promise((resolve,reject) => {
        axios
        .post(url, params)
        .then((res) => {
            resolve(res.data);
        })
        .catch((err) => {
            reject(err.data);
        });
    });
  }
1行——引用Axios
2行——设置头请求application/json;charset=utf-8
5-16行——使用Promise设置同步
src => api => mudelu => first.js
import {post} from "../http"
export const getList = params => post('api/data',params)

export function getstudentList(data) {
    return Request({
        url:'',
        method:'post',
    })
}
2行——定义了getlist方法
4-9行——数据获取
vue.config.js
module.exports = {
    devServer: {
        open:process.platform === 'darwin',
        host:'0.0.0.0',
        post:8080,
        https:false,
        hotOnly:false,
        proxy: {
            '/api': {
                target:'http://119.3.172.37:8999/api',
                changeOrigin:true,
                secure:false,
                pathRewrite:{
                    '^/api': ''
                }
            }
        }
    }
}
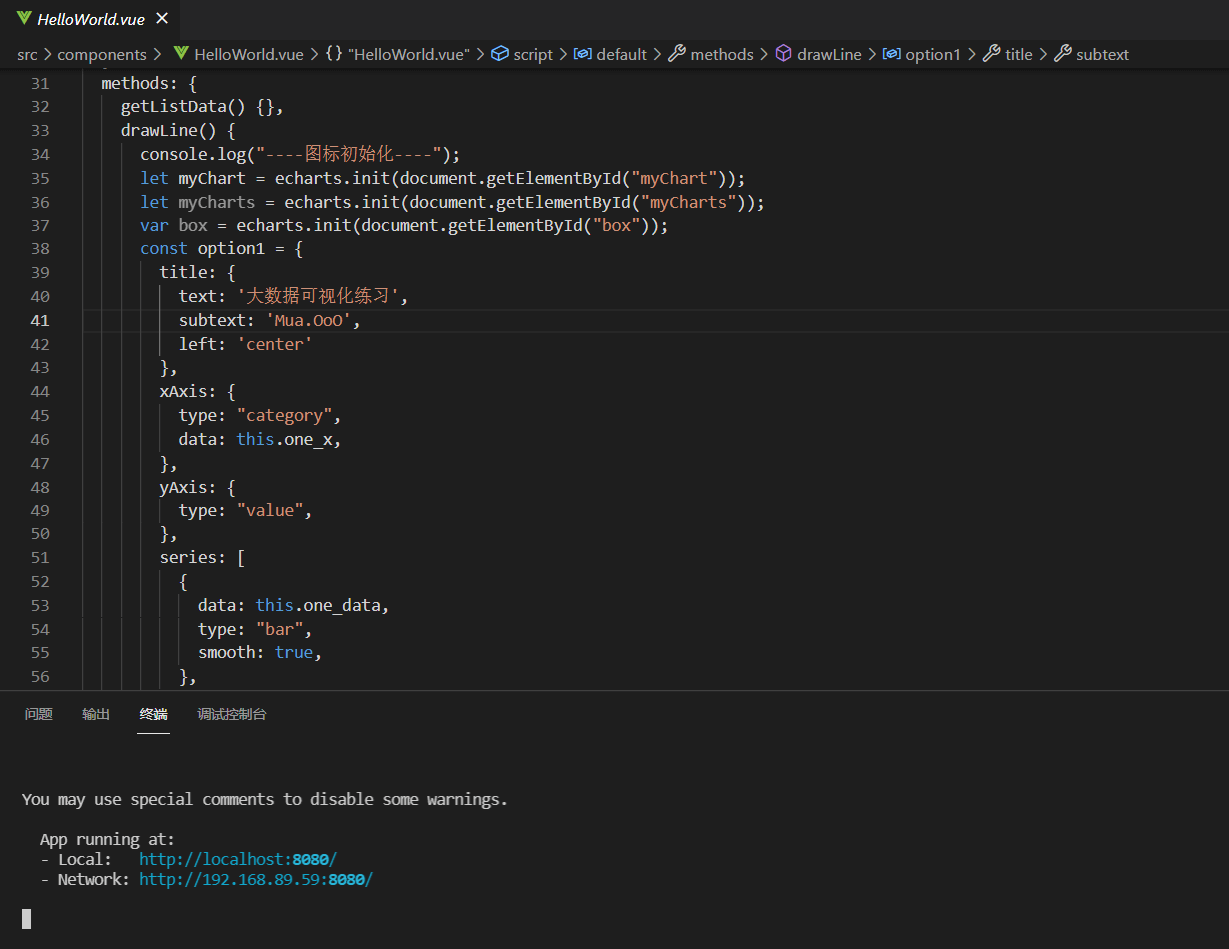
HelloWorld.vue
这几天要把这个代码啃下来 
<template>
<div id="myChart" style="width: 1500px; height: 600px; margin: 0 auto">
图表
</div>
<div id="myCharts" style="width: 300px; height: 400px; margin: 0 auto">
图表
</div>
<div id="box" style="width: 1400px; height: 600px; margin: 0 auto">图表</div>
</template>
<script>
import { getList } from "@/api/module/first";
let echarts = require("@/assets/echarts.min.js");
export default {
name: "hello",
data() {
return {
list: [],
one_data: [],
one_x: [],
};
},
created() {
console.log("----处理数据----");
this.getListData();
},
mounted() {
console.log("----图标初始化----");
this.drawLine();
},
methods: {
getListData() {},
drawLine() {
console.log("----图标初始化----");
let myChart = echarts.init(document.getElementById("myChart"));
let myCharts = echarts.init(document.getElementById("myCharts"));
var box = echarts.init(document.getElementById("box"));
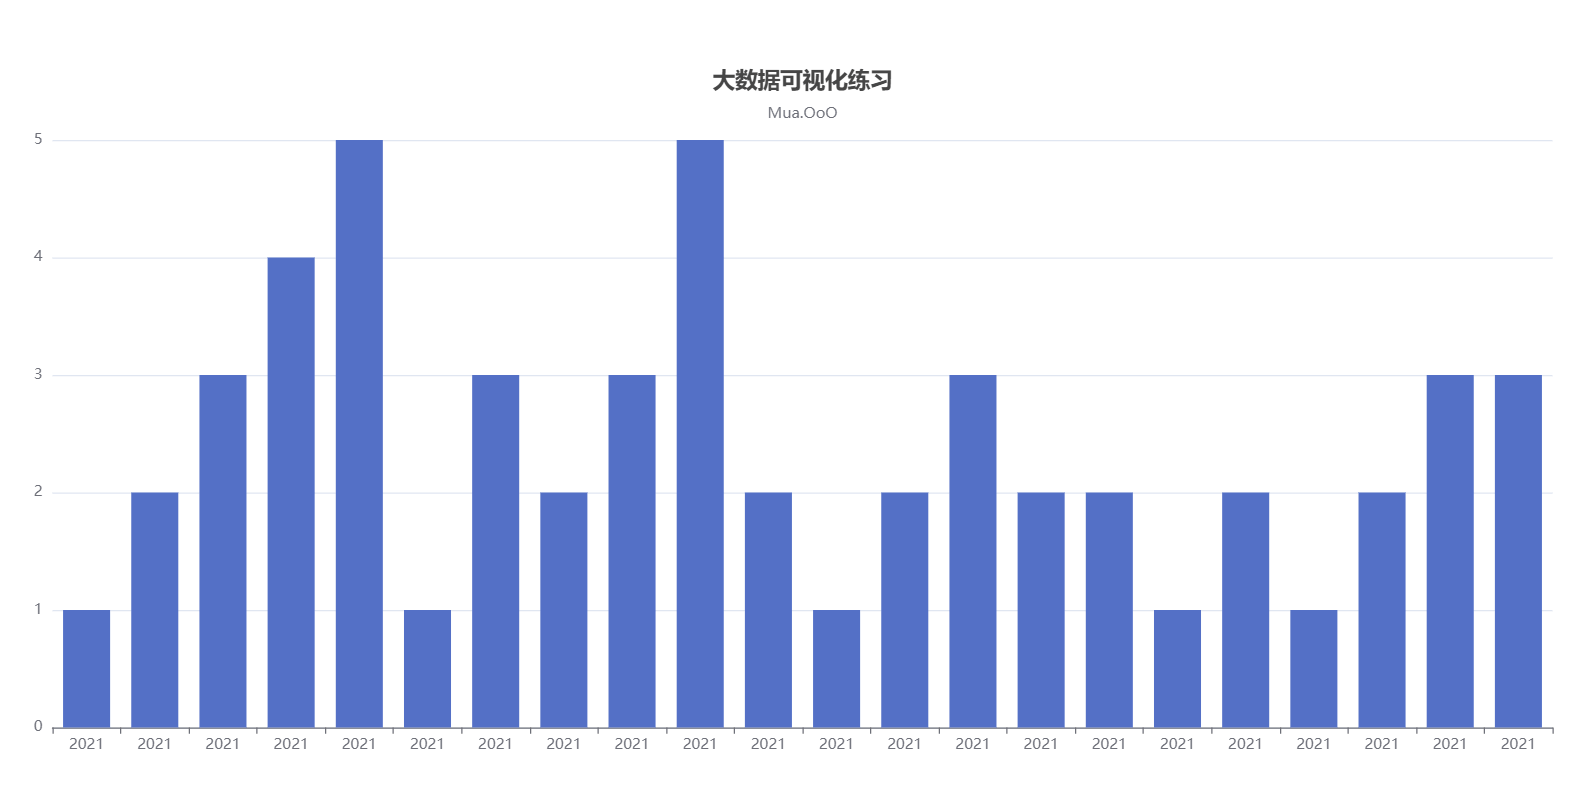
const option1 = {
title: {
text: '大数据可视化练习',
subtext: 'Mua.OoO',
left: 'center'
},
xAxis: {
type: "category",
data: this.one_x,
},
yAxis: {
type: "value",
},
series: [
{
data: this.one_data,
type: "bar",
smooth: true,
},
],
};
let name = {
start: "202101",
end: "202105",
};
getList(name).then((res) => {
console.log("----处理数据----");
this.list = res.data;
this.list.forEach((x) => {
console.log(x.year);
this.one_x.push(x.year);
this.one_data.push(x.month);
});
option1 && myChart.setOption(option1, true);
});
},
},
};
</script>
<style scoped>
* {
margin: 0;
padding: 0;
list-style: none;
}
</style>
不是教程文章  ,最近在学习大数据可视化,算是记一记笔记~
,最近在学习大数据可视化,算是记一记笔记~
评论已关闭 >_<